

Run your collection
on real numbers
Rebin turns the data from all your containers into one clear report, per region or waste stream. You see where you empty too early or too late, and back every decision with numbers.
- All your figures at a glance
- Trends per stream or region
- Export everything to CSV
Trusted by 40+ cities, ports and sites




The numbers behind every collection
Three views that turn raw sensor data into figures your team and your board can use.
KPIs at a glance
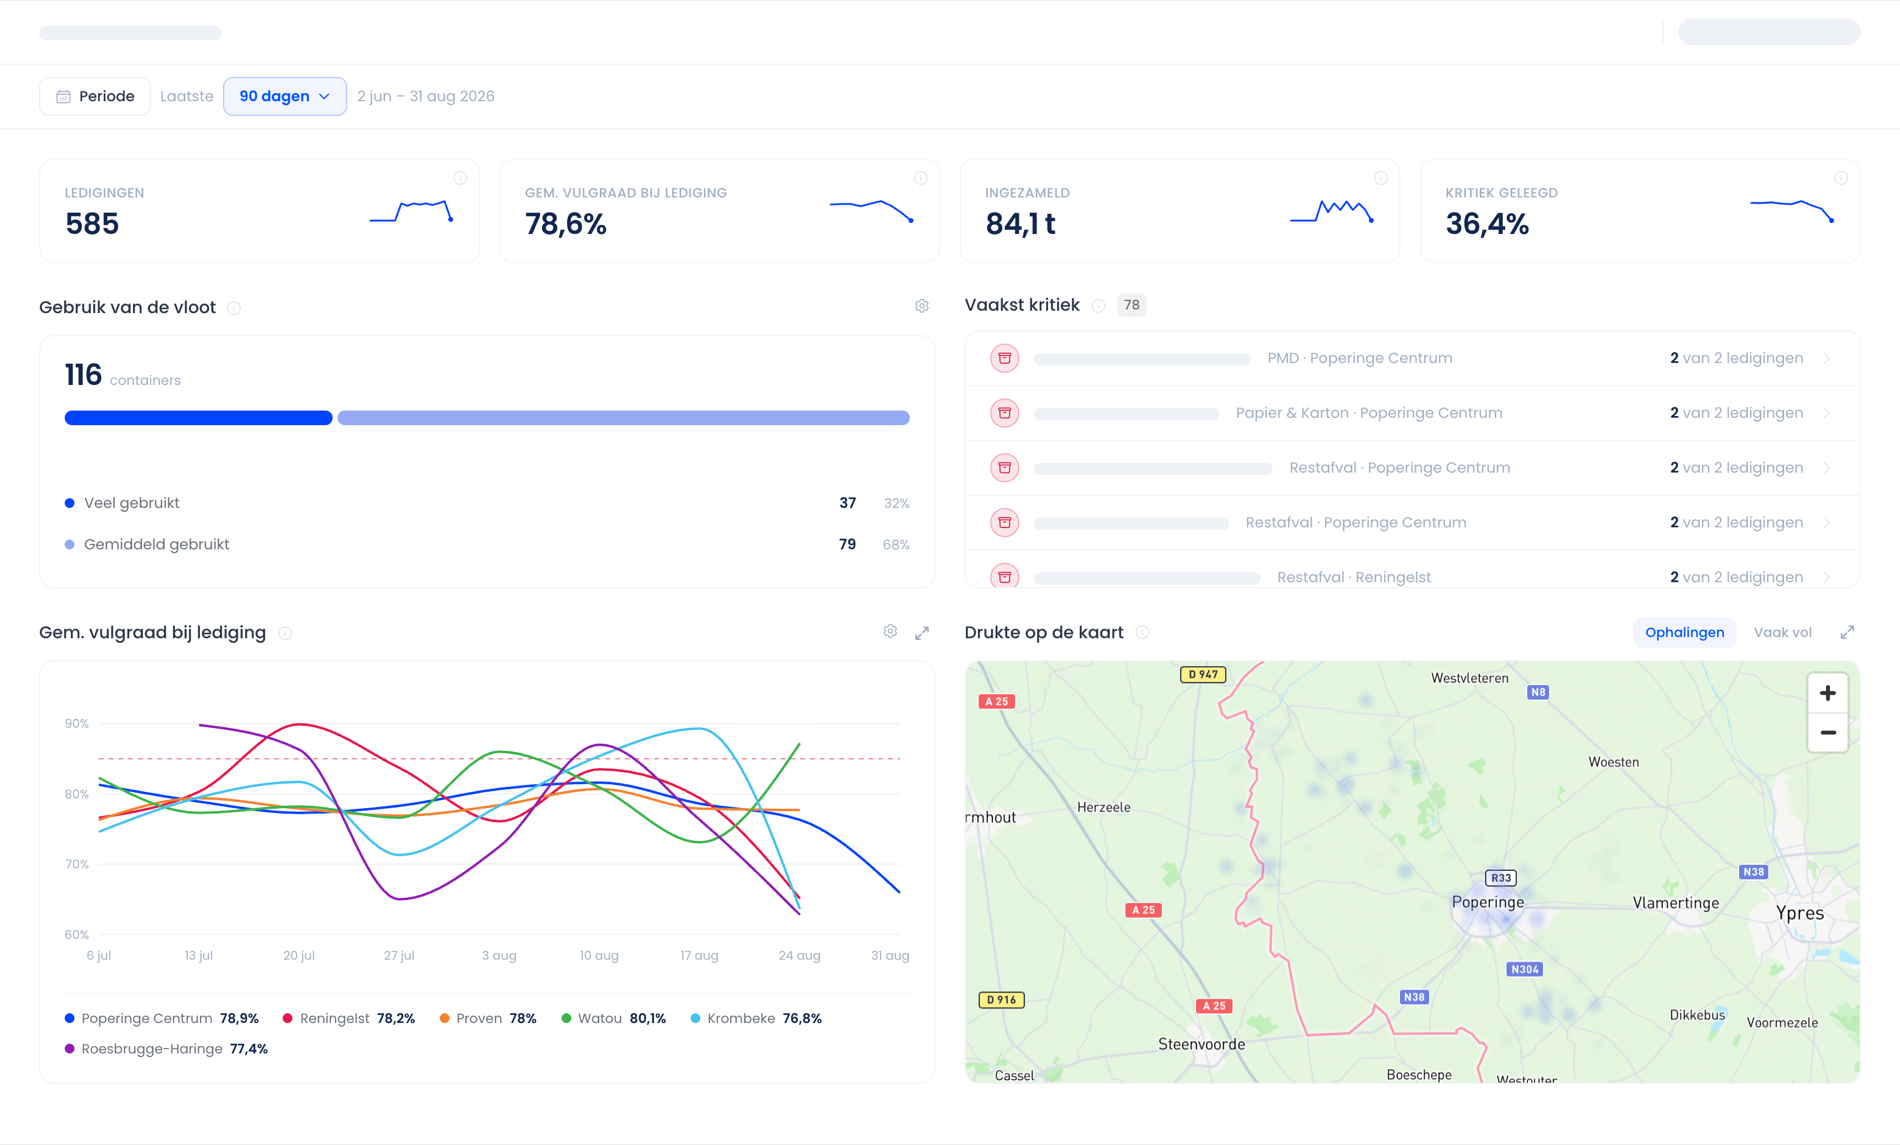
Number of collections, average fill level at collection, weight collected and the share of containers emptied at a critical level. Each KPI shows its trend over the period you choose.
Fleet usage
Which containers are used heavily and which hardly at all? The platform groups your containers automatically and shows which locations are often critical, so you can move capacity where it is needed.
Fill-level trends per region or waste stream
Follow how the average fill level at collection develops and compare regions, waste streams or individual containers. You see straight away where you empty too early or too late.
All your figures in one report
Collections, average fill level and collected weight over any period you choose. See which containers are critical most often and how each region evolves.
Questions about reporting & insights
Which numbers you get, how you share them and how far back the data goes.
By default: the number of collections, the average fill level at collection, the weight collected and the share of containers emptied at a critical level. Every KPI also shows its trend over the chosen period.
Yes. Pick the last 7, 30 or 90 days, or set your own start and end date. All charts and KPIs update instantly.
Yes. Every table and chart exports to CSV, so you can work with the numbers in Excel, Power BI or your own reporting.
Yes. Split any chart by district, waste stream or individual container and put them side by side in one view.
All measurements are stored from the moment a sensor is installed. So you can compare year on year and track the impact of policy decisions.
That is up to you. Give colleagues, the board or external waste collectors read access to the reporting, without access to the operational modules.



Trusted by 40+ cities, ports and sites
Ready to drive less?
43% shorter collection trips on average. Lower costs. Fewer overflows.